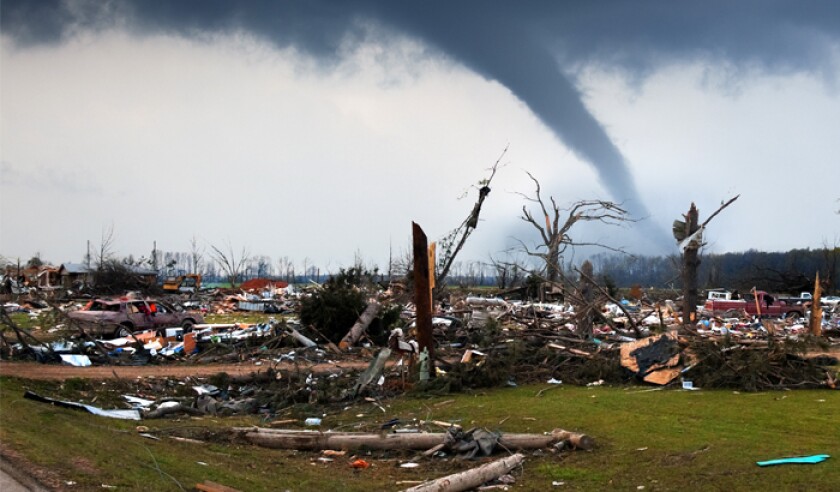
First-half loss analyses from Aon, Gallagher Re, Munich Re and Swiss Re all support the now-established truth that severe convective storms (SCS), mainly US, account for the biggest share of global insured cat losses.
Swiss Re puts SCS losses at $42bn, or 70% of global cat losses of $60bn, in H1.
Meanwhile Gallagher Re notes $100bn of US SCS losses over the 18-month period from January 2023 to June 2024, adding that it was the costliest stretch on record for the peril.
In this piece, Insurance Insider ILS explores the themes emerging from the H1 cat loss analyses – namely, the primacy of SCS in global loss tallies and the need for better modelling to manage and understand the risks.
Steve Bowen, chief science officer at Gallagher Re, told this publication, “It’s pretty difficult to look away, and not to recognise that this is certainly not a secondary peril,” adding that the outsized role played by SCS is influencing how reinsurers view the peril.
While far behind SCS, floods also caused above-average insured losses in H1 of $8bn according to Aon, and $10bn according to Gallagher Re, driven by events in the United Arab Emirates and Germany.
Given the likelihood of more rainfall in warming climate alongside the expansion of the urbanised footprint, scientists who spoke to this publication all agreed that multi-billion-dollar loss events from these perils would likely become more common.
The dominance of SCS
Severe thunderstorms or SCS, characterised by strong winds including tornadoes, hail and heavy rain, took centre stage for losses.
Swiss Re found that H1 2024 was the second-costliest on record for insured losses from severe thunderstorms, with $42bn, which is 87% higher than the 10-year average. Aon pegged the peril with constituting roughly three-quarters of its total estimate of insured losses.
This peril was especially active in the US, and Gallagher Re found that US SCS accounted for 61% of all global insured losses, while Aon called it an “an unforgettable year” for SCS in the US.
Earlier this year, Swiss Re found that, particularly in the US, the annual expected losses for SCS have been increasing over the last about 15 years by about 8% per year on average.
“It really starts and I don't want to say stops, but it certainly starts with SCS In the US. We had another incredibly active first six months of the year and that has continued into July and early August,” said Bowen.
The US accounted for six of the top 10 costliest insured loss events of H1 2024, according to Gallagher Re, with each of the top 10 events resulting in a multi-billion-dollar insured loss for private and public insurers. The six US events were all SCS.
The country recorded 13 individual billion-dollar insured SCS events, of which eight topped $2bn, including in mid-March, H1’s costliest insured event, which has thus far resulted in $4.7bn in claims payouts, according to Gallagher Re.
Swiss Re said that, in the US, 12 storms each caused losses of $1bn or more, demonstrating the loss potential of this peril.
There are a multitude of factors that are causing the increasing severity of this peril, according to the experts.
Elisabeth Viktor, senior nat cat specialist at Swiss Re, said: “The main driver obviously is inflation, but then more specifically, also inflation linked to construction cost. Another very important point is economic growth and urbanisation in that regard, especially also urban sprawl and spatial expansion. You have more people and more values in harm's way.”
She added that the vulnerabilities are also changing. “We're trying to transition our energy system so there are more solar panels, for example, on roofs. That changes the loss patterns that we see as well.”
Different materials linked to the energy transition has driven up loss costs as well. The insulation used for new houses can be prone to more hail losses, for example, as they're a bit softer, she explained.
Hail was another driver of insured costs across central and eastern portions of the US, in addition to an above-average volume of tornadoes and non-tornadic wind occurrences.
Roughly 50%-80% in any given year of thunderstorm-related claims are from hail, Bowen said.
“That is definitely something that that we're continuing to watch, whether that's because we've seen more phases of La Niña in the US over the last few years, which typically causes an earlier start to severe weather season and basically extends the longevity of the season,” he said.
The unabating US SCS activity has brought significant challenges to primary carriers, with losses staying highly elevated. “It's become more expensive and more difficult for primary carriers to be able to get access to aggregate coverage from reinsurers to protect themselves, and what that means is that a lot of these losses are just largely being absorbed by primary carriers; it's really eating into their quarterly earnings and loss ratios,” said Bowen.
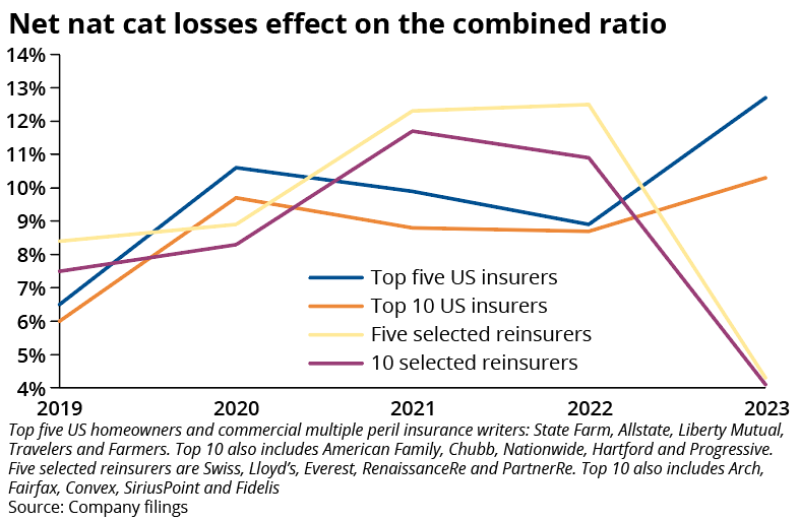
The reinsurance market shifted in 2023 with major price increases – particularly in short-tail lines – and tightening of terms to better account for rising secondary perils such as SCS. As a result, primary insurers have retained more risk and their share of natural catastrophe losses rose to a five-year high in 2023, according to S&P.
In its latest report, Reinsurers Dodge Severe Convective Storm Losses Amid Rising Threats, S&P found that in 2023 the top 10 US homeowners and commercial multiple peril property insurers reported a 2.2-point increase in the impact of natural catastrophe losses on their underwriting results to 10.3 points, compared with the average of the previous four years. For the top five insurers, the deterioration was 3.7 points.

Viktor explained that it's difficult to model US SCS perils. “We have much better instrumentation than we had a couple of decades ago, but it's still difficult to capture all of the details of those events.
“So we're relying on proxies that tell us what the likelihood or a favourable environment is for events to see how these environments might change in the future, and there we also see contradictory developments.”
The peaking of non-peak perils
In addition to severe thunderstorms, flooding and harsh winter weather early in the year produced losses in the billions.
Losses from flooding surpassed the 10-year average mark at $8bn, and there were multiple individual non-US events that resulted in a multi-billion-dollar impact for the industry. Gallagher Re reported that shifts in the jet stream led to periods of extreme precipitation or drought in parts of South America, Africa and Asia.
In April, torrential rain caused by severe thunderstorms led to flash floods on the Arabian Peninsula, resulting in unprecedented damage in the UAE. The unexpected disaster, during which Dubai received the heaviest rains in the past 75 years, has been deemed the country’s costliest natural disaster on record, with insured losses ranging between $2bn and $2.95bn according to the H1 reports.
Late April and May also saw historic flooding affecting Brazil’s Rio Grande do Sul state, which became the nation's costliest flooding event on record, according to Gallagher Re.
Also in May, Germany experienced severe storms and flooding with insured losses of about $2.2bn, according to an estimate by Munich Re, while June saw extensive flooding in southern and central China which caused significant economic losses of $5bn-$6.3bn, of which only a small portion was insured, according to the reports.
Aon said these flooding losses brought into focus the insufficient drainage infrastructure in rapidly growing cities and the need for better adaptation measures.
The UAE losses threw into focus the many issues with urban infrastructure. Gallagher Re noted that losses were elevated due to rapid urbanisation that has been “marked by dramatic changes in local land use”.
It added that, with so much rain falling on arid soils and desert conditions, this put tremendous strain on local infrastructure unequipped to handle such large volumes of water.
Additionally, the unexpected disaster also threw into focus not just vulnerabilities in infrastructure, but also in industry’s catastrophe modelling and pricing, echoing sentiments for US SCS modelling.
“There just is not a robust historical set of observational data to reasonably put together stochastic events based on history, because the history is just not that extensive from a data standpoint,” said Bowen.
He added that this was true not just for the Middle East, but also Africa, other parts of Asia, Latin America and even Europe. There are lots of opportunities for more modelling, but a greater insurance presence was likely needed to justify the spend for many vendors, he added.
“It's a very, very difficult exercise and no one expects perfection, but there's certainly a pretty healthy amount of runway for all of us to go,” said Bowen.
Global natural catastrophes
An active first half of 2024 for global natural catastrophes overall resulted in economic losses of $117bn-$128bn, which was lower than the same period last year, according to the reports.
However, insured losses ranged between $58bn and $62bn, far surpassing benchmark 10-year and long-term averages.
Gallagher Re found that there were at least 19 individual billion-dollar insured loss events, marking the second-highest H1 total on record behind the 20 in 2023 and 2022. In addition, 12 of those events resulted in a multi-billion-dollar loss.
Bowen noted that while H1 losses were higher than over the last decade, comparisons to longer-term benchmarks such as 10-year or 21st-century averages is becoming less helpful in terms of a loss analysis.
He added that H1 was not “anomalous” when taking a five-year comparison. “It was still a bit higher, but not leaps and bounds higher if you were comparing it to the 2000 to 2023 average.”
“Over the last 10-15 years, it feels like we're seeing a pretty notable step up in terms of the level of loss, so having a more short-term view is probably going to be at least a safer option in terms of how we are trying to assess and assume what loss costs are going to look like.”
